Table of Contents
Introduction
Project History and Research Methodology
Digital Talking Books
Guidelines for Describing STEM Images
Bar Charts
Line Graphs
Venn Diagrams
Scatter Plots
Tables
Pie Charts
Basic Flow Chart
Example H: Standard Diagrams and Illustrations
Example I: Complex Diagrams and Illustrations
Math Equations
Resources
Training Events
Acknowledgements
Basic Flow Chart

Guidelines:
- Flow charts are a common method of presenting information and one of the most difficult images to describe.
- Simple flow charts can be converted into nested lists with good results. Present the "boxes" as numbers and the possible transitions as sub-bullets.
- For some people, combining description with a tactile version of a flow chart facilitates comprehension.
- It is not necessary to describe the visual attributes of the charts, e.g. yellow boxes, curved arrows, etc., unless there is an explicit need such as an exam question referring to these attributes.
Description:
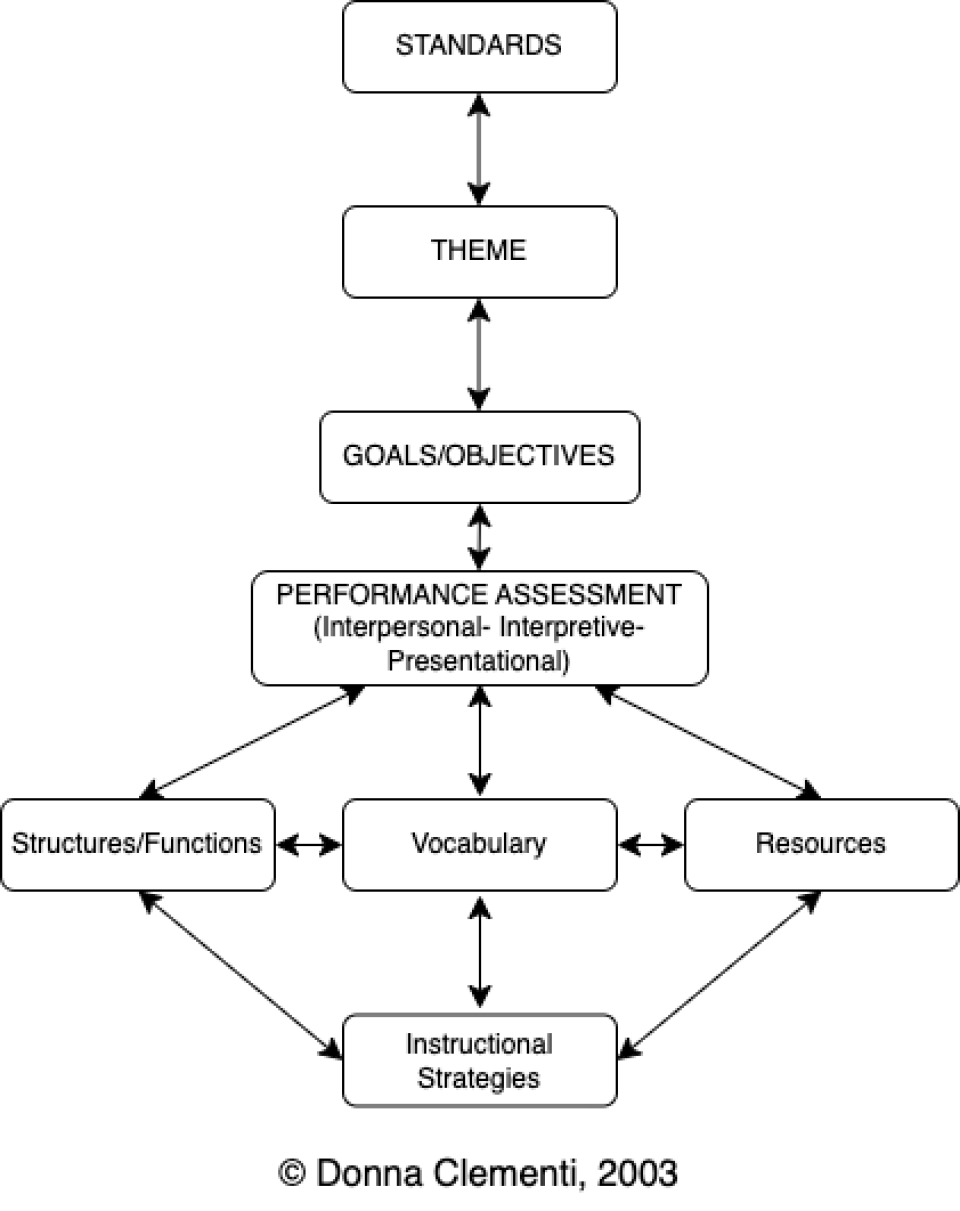
The figure is a flow chart with eight labeled boxes linked by arrows.
The chart is multi-directional. At each step, arrows point forward to one or more boxes and back to the previous box or boxes.
Here the flow chart is described as lists in which the possible next steps are listed beneath each box label.
- a. forward to Theme
- a. back to Standards
- b. forward to Goals/Objectives
- a. back to Theme
- b. forward to Performance Assessment
- a. back to Goals/Objectives
- b. forward to Structures/Functions
- c. forward to Vocabulary
- d. forward to Resources
- a. back to Performance Assessment
- b. lateral to Vocabulary
- c. forward to Instructional Strategies
- a. back to Performance Assessment
- b. lateral to Structures/Functions
- c. lateral to Resources
- d. forward to Instructional Strategies
- a. back to Performance Assessment
- b. lateral to Vocabulary
- c. forward to Instructional Strategies 8. Instructional Strategies
- a. back to Structures/Functions
- b. back to Vocabulary
- c. back to Resources
Flow Chart with Multiple Start Points

Guidelines:
- Visually, a flow chart can convey complex relationships almost instantly. In this example, one can quickly see that the main process can begin in three different ways and that there are two other processes that are closely related but not directly connected.
- Begin with a brief overview, explaining the distinct elements of the image, including if it has multiple starting points, additional lists, etc.
- Describe each section of the flow chart linearly, using nested lists as an organizing tool.
- Combining description with a tactile version of a flow chart may provide increased access.
- It is not necessary to describe the visual attributes of the charts, e.g. yellow boxes, curved arrows, etc., unless there is an explicit need such as an exam question referring to these attributes.
- It may be helpful to explicitly state when the different lines merge.
Description:
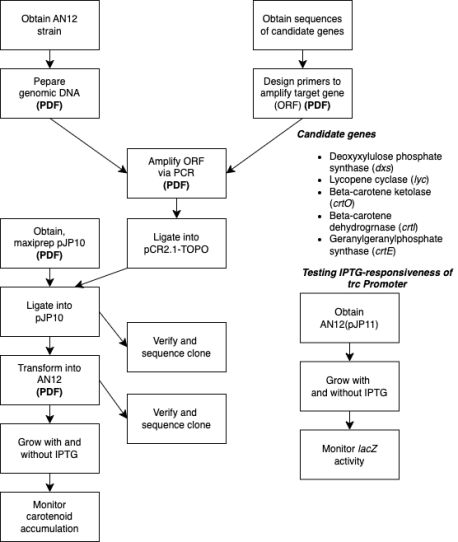
The figure includes one large flow chart, one small flow chart and a list. Here the flow charts are represented as lists.
Large Flow Chart
The large flow chart has three different starting points, presented here as separate lists with numbered steps. When a step has more than one possible next step, they are listed beneath it.
Starting point A
1. Obtain AN12 strain
2. Prepare genomic DNA
3. Amplify ORF via PCR
4. Ligate into pCR2,1-TOPO
5. Ligate into pJP10
- Verify and sequence clone
- Transform into AN12
6. Transform into AN12
- Verify and sequence clone
- Grow with and without IPTG
7. Grow with and without IPTG8. Monitor carotenoid accumulation
Starting point B
1. Obtain sequence of candidate genes
2. Design primers to amplify target gene (ORF)
3. Amplify ORF via PCR
4.Ligate into pCR2,1-TOPO
5. Ligate into pJP10
- Verify and sequence clone
- Transform into AN12
6. Transform into AN12
- Verify and sequence clone
- Grow with and without IPTG
7. Grow with and without IPTG8. Monitor carotenoid accumulation
Starting point C
1. Obtain maxiprep pJP10
2. Ligate into pJP10
- Verify and sequence clone
- Transform into AN12
3. Transform into AN12
- Verify and sequence clone
- Grow with and without IPTG
4. Grow with and without IPTG5. Monitor carotenoid accumulation
Small Flow Chart
The small flow chart has three steps. Testing IPTG-responsiveness of trc Promoter
- Obtain AN12 (pJP11)
- Grow with and without IPTG
- Monitor IacZ activity
List
Candidate genes
- Deoxyxylulose phosphate synthase (dxs)
- Lycopene cyclase (lyc)
- Beta-carotene ketolase (crtO)
- Beta-carotene dehydrogrnase (crtl)
- Geranylgeranylphosphate synthase (crtE)
Flow Chart with Complex Paths

Guidelines:
- At first, this flow chart may seem impossible to describe. Even visually, the process it illustrates is not immediately obvious and appears rather complex.
- Convert the flow chart into a single linear list, with the possible next steps of each box or item nested below it.
- A tactile version may add accessibility.
Description:
The figure is a flow chart with 7 stages of action. 3 types of lines represent different transitions between the stages of action.
The lines are labeled: Expected transitions, Non-problematic unexpected transitions, and Problematic unexpected transitions.
Here the flow chart is described as a nested list in which possible transitions are listed beneath each stage of action.
1. Forming the goal
- Expected transition to Forming the intention
2. Forming the intention
- Expected transition to Specifying the action
3. Specifying the action
- Expected transition to Executing the action
4. Executing the action
- Expected transition to Perceiving the system state
- Non-problematic unexpected transition to Executing the action
- Non-problematic unexpected transition to Specifying the action
5. Perceiving the system state
- Expected transition to Interpreting the system state
- Problematic unexpected transitions to Perceiving the system state
- Problematic unexpected transitions to Executing the action
6. Interpreting the system state
- Expected transition to Evaluating the outcome
- Problematic unexpected transition to Interpreting the system state
- Non-problematic unexpected transitions to Executing the action
- Non-problematic unexpected transitions Specifying the action
7. Evaluating the outcome
- If intention is maintained, and a new action is required then Expected transition to Specifying the action
- If a new intention is warranted then Expected transition to Forming the intention
Process Diagram as Flow Chart

Guidelines:
- This illustration shows a process. One way to make this accessible is to lay out the steps in a list, similar to the recommendation for flow charts.
- Again, the illustration itself is colorful and visually interesting but it doesn't provide additional information beyond the data.
Description:
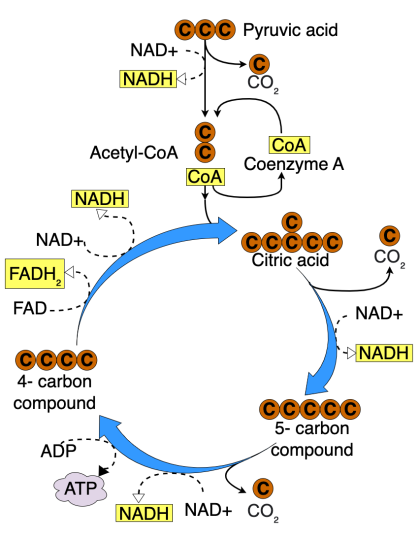
The Krebs Cycle is depicted as a linear reaction which leads downward into a cyclical reaction. Here, the steps of the reactions are presented as lists.
1. Linear Reaction
- Pyruvic acid, a 3-carbon compound.
- One carbon molecule is lost as part of a CO2 molecule.
- An NAD-positive molecule enters the reaction, then leaves as NADH.
- A 2-carbon acetyl group remains.
- Coenzyme A, or CoA, joins the 2-carbon acetyl group to form Acetyl CoA.
- CoA leaves the reaction as it delivers the acetyl group to the circular reaction.
2. Circular Reaction
- The two-carbon acetyl group joins a four-carbon compound to form a 6-carbon compound, citric acid.
- A carbon is lost as CO2.
- NAD-positive enters, then leaves as NADH.
- A 5-carbon compound remains.
- another carbon is lost as CO2.
- NAD-positive comes in and leaves as NADH.
- ADP comes in and leaves as ATP.
- A four-carbon compound remains.
- FAD comes in and leaves as FADH2.
- NAD-positive comes in and leaves as NADH.
- Back again at the top of the circular reaction, a two-carbon acetyl group from the linear reaction enters, forming the 6-carbon citric acid at the beginning of the cycle.
Funding for this project is provided by the National Science Foundation.
Contact NCAM
NCAM at GBH
One Guest Street
Boston, MA 02135